Statistical Significance and Its Part in Science Downfalls

 Imagine if there were a simple single statistical measure everybody could use with any set of data and it would reliably separate true from false. Oh, the things we would know! Unrealistic to expect such wizardry though, huh?
Yet, statistical significance is commonly treated as though it is that magic wand. Take a null hypothesis or look for any association between factors in a data set and abracadabra! Get a “p value” over or under 0.05 and you can be 95% certain it’s either a fluke or it isn’t. You can eliminate the play of chance! You can separate the signal from the noise!
Except that you can’t. That’s not really what testing for statistical significance does. And therein lies the rub.
Testing for statistical significance estimates the probability of getting at least that result if the study hypothesis is assumed not to be true. It can’t on its own prove whether this assumption was right, or whether the results would be the same in different circumstances. It provides a limited picture of probability, taking limited information about the data into account and giving only “yes” or “no” as options.
What’s more, the finding of statistical significance itself can be a “fluke,” and that becomes more likely in bigger data and when you run the test on multiple comparisons in the same data. You can read more about that here.
Statistical significance testing can easily sound as though it sorts the wheat from the chaff, telling you what’s “true” and what isn’t. But it can’t do that on its own. What’s more, “significant” doesn’t mean it’s important either. A sliver of an effect can reach the less-than-5% threshold. We’ll come back to what all this means practically shortly.
The common approach to statistical significance testing seemed so simple to grasp, though, and so easy to do even before there were computers, that it took the science world by storm. As Stephen Stigler explains in his piece on Fisher and the 5% level, “it opened the arcane domain of statistical calculation to a world of experimenters and research workers”.

But it also led to something of an avalanche of abuses. The over-simplistic approach to statistical significance has a lot for which to answer. As John Ioannidis points out here, this is a serious player in science’s failure to replicate results.
Before we go any further, I need to ‘fess up. I’m not a statistician but I’ve been explaining statistical concepts for a long time. I took the easy way out on this subject for the longest time, too. But I now think the perpetuation of the over-simplified ways of explaining this in so much training is a major part of the problem.
The need for us to get better at communicating the complexity of what statistical significance does and does not mean burst forth in question time at our panel on numbers at the recent annual meeting of the National Association of Science Writers in Florida.

Fellow statistics enthusiast and SciAm blogger Kathleen Raven organized and led the panel of me, SciAm mathematician blogger Evelyn Lamb, statistics professor Regina Nuzzo, and mathematician John Allen Paulos. Raven is organizing an ongoing blog called Noise and Numbers, around this fun-loving science-writing crew. (My slides for that day are here.)
Two of the points I was making there are relevant to this issue. Firstly, the need to avoid over-precision and take confidence intervals or standard deviations into account. When you have the data for the confidence intervals, you have a better picture than statistical significance’s p value can possibly provide. It’s far more interesting and far more intuitive, too. You can learn more about these concepts here and here.
Secondly, it’s important to not consider the information from one study in isolation, a topic I go into here. One study on its own is rarely going to provide “the” answer.

Which brings us at last to Thomas Bayes, the mathematician and minister from the 1700s whose thinking is critical to debates about calculating and interpreting probability. Bayes argued that we should consider our prior knowledge when we consider probabilities, not just count the frequency of the specific data set in front of us against a fixed, unvarying quantity regardless of the question.
You can read more about Bayesian statistics here on the Wikipedia. An example given there goes like this: suppose someone told you they were speaking to someone. The chances the person was a woman might ordinarily be 50%. But if they said they were speaking to someone with long hair, then that knowledge could increase the probability that the person is a woman. And you could calculate a new probability based on that knowledge.
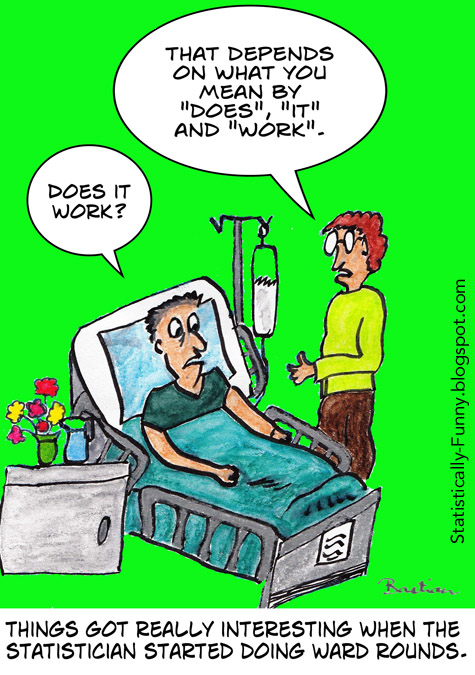
Statisticians are often characterized as either Bayesians or frequentists. The statistician doing the ward rounds in my cartoon at the top of this post is definitely a Bayesian!
An absolute hewing to p <0.05 (or 0.001) no matter what would be classically frequentist. Important reasons for being concerned to do this are the weakness of much of our prior knowledge – and the knowledge that people can be very biased and may play fast and loose with data if there aren’t fixed goal posts.
Bayesianism has risen and fallen several times, but increasing statistical sophistication and computer power is enabling it to come to the fore in the 21st century. Nor is everyone in one or the other camp: there’s a lot of “fusion” thinking.
Valen Johnson has just argued in PNAS (Proceedings of the National Academy of Sciences in the USA) that Bayesian methods for calculating statistical significance have evolved to the point that they are ready to influence practise. The implication, according to Johnson, is that the threshold for statistical significance needs to be ratcheted much, much lower – more like 0.005 than 0.05. Gulp. The implications of that for sample sizes needed for clinical studies would be drastic.
 It doesn’t really all come down to where the threshold for a p value is, though. Statistically significant findings may be important or not for a variety of reasons. One rule of thumb is that when a result does achieve that numerical level, the data are showing something, but it always needs to be embedded in a consideration of more than that. Factors such as how big and important the apparent effect is, and whether or not the confidence intervals suggest the estimate is an extreme long shot or not matter too.
What the debate about the level of statistical significance doesn’t mean, though, is that not being statistically significant is irrelevant. Data that aren’t reaching statistical significance are too weak to reach any conclusion. But just as being statistically significant doesn’t mean something is necessarily “true,” not having enough evidence doesn’t necessarily prove that something is “false.” More on that here.
The debate about Bayesians versus frequentists and hypothesis testing is a vivid reminder that the field of statistics is dynamic – just like other parts of science. Not every statistician will see things the same way. Theories and practises will be contested, knowledge is going to develop. There are many ways to interrogate data and interpret their meaning, and it makes little sense to look at data through the lens of only one measure. The p value is not one number to rule them all.
Update 7 March 2016:
The American Statistical Association released 6 statements of principle about p-values:
- P-values can indicate how incompatible the data are with a specified statistical model.
- P-values do not measure the probability that the studied hypothesis is true, or the probability that the data were produced by random chance alone.
- Scientific conclusions and business or policy decisions should not be based only on whether a p-value passes a specific threshold.
- Proper inference requires full reporting and transparency.
- A p-value, or statistical significance, does not measure the size of an effect or the importance of a result.
- By itself, a p-value does not provide a good measure of evidence regarding a model or hypothesis.
~~~~
Click on Statistics in the cloud tag to the right to see other posts that are relevant.
A good book free online to help with understanding health statistics is Know Your Chances by Steve Woloshin, Lisa Schwartz and Gilbert Welch.
See also Steven Goodman’s A Dirty Dozen: Twelve P-Value Misconceptions. Gerd Gigerenzer tackles the many limitations and “wishful thinking” about simple hypothesis and significance tests in his article, Mindless statistics. The Wikipedia is a good place to start to learn more too. Another good article on understanding probabilities is by Gerd Gigerenzer and Adrian Edwards here.
Relevant posts on Statistically Funny are:
- You will meet too much false precision
- Nervously approaching significance
- Don’t worry…it’s just a standard deviation
- Alleged effects include howling
The Statistically-Funny cartoons are my original work (Creative Commons, non-commercial, share-alike license).
The picture of the portrait claiming to depict Thomas Bayes is from Wikimedia Commons.
*The thoughts Hilda Bastian expresses here at Absolutely Maybe are personal, and do not necessarily reflect the views of the National Institutes of Health or the U.S. Department of Health and Human Services.